
PseudoPremium: Optimizing Visitor Experience at Universal's Islands of Adventure
Optimization MILP Operations Research
ECE/CS/ISyE 524 Introduction to Optimization
Overview
This project asked a practical operations-research question: how should a visitor allocate a fixed day at a theme park to maximize enjoyment under limited time and long ride queues? We framed that problem around Universal’s Islands of Adventure and built an optimization model that recommends how many times a visitor should take each ride based on ride-specific satisfaction, average waiting times, ride durations, and additional scenario constraints.
The result was a mixed-integer linear programming formulation for personalized theme-park planning. Rather than trying to reproduce every detail of a real park visit, the project focused on the main tradeoff that matters most to guests: how to convert a limited number of hours into the highest possible satisfaction while avoiding excessive waiting.
Motivation
Theme parks are a clean example of constrained decision-making. Visitors face a limited time horizon, highly variable ride popularity, and competing priorities between must-do attractions and efficient overall planning. That makes the park-planning problem a natural fit for optimization.
What made the project interesting is that the naive objective is not quite right. If we only maximize ride preference, the model may overcommit to high-demand attractions with long lines. If we only minimize waiting time, the itinerary becomes efficient but uninteresting. The real problem is the tradeoff between ride quality and queue cost, plus practical decisions such as whether an express pass is worth the money or how much peak-season crowding changes the optimal plan.
Mathematical model
We modeled the problem as a MILP with binary decision variables indicating whether ride is taken for the -th time. The notebook allowed up to 10 repeats per ride across 17 rides within a 12-hour planning horizon.
To reflect diminishing enjoyment from repetition, the project used a decaying satisfaction rule:
where is the satisfaction score for the first time taking ride . This captured the idea that the first ride matters most and repeated rides become less valuable.
The base objective was to maximize total satisfaction:
subject to a time-budget constraint and monotonic ride-repeat constraints so that the model could not select the third ride of an attraction without also selecting the first and second.
The project then extended this base formulation in several ways:
- Ride-time model: includes both waiting time and time spent on the ride.
- Tradeoff model: introduces a penalty on waiting time using a parameter .
- Must-ride constraints: forces selected popular rides to appear at least once.
- Express-pass model: sets the first wait for eligible rides to zero to simulate a one-time express pass.
- Peak-season model: replaces offseason average wait times with peak-season averages.
The tradeoff objective is the most interesting variant because it makes the optimization explicitly multi-objective in spirit:
That parameterized the tension between visitor enjoyment and queue avoidance and produced a Pareto-like frontier of possible park experiences.
What we built
The implementation was written in Julia using JuMP with the GLPK solver. The notebook assembled ride duration, average wait-time, and satisfaction inputs into matrix form so each scenario could reuse the same decision structure with only modest changes to the objective or constraints.
The data pipeline combined:
- ride lists from official park information,
- average wait times for off-peak and peak conditions,
- ride durations,
- and ride-preference scores derived from ratings as a proxy for user satisfaction.
An important modeling simplification was to use average wait times rather than fully time-varying queues. That made the optimization tractable and easier to interpret, but it also meant the model optimized the number of times to ride each attraction, not the exact route or clock-time schedule through the park.
Key findings
Base optimization over-favors efficient rides
The simplest model, which ignored ride time and optimized only over average queue time, favored attractions with relatively low waits even if they were not the most exciting rides. The notebook discussion points out that high-satisfaction but long-wait rides like Hagrid’s Magical Creatures Motorbike Adventure were often excluded because the solver preferred multiple lower-wait alternatives.
That result is useful because it exposes the failure mode of a too-simple objective: maximizing satisfaction under waiting-time constraints alone can produce a mathematically efficient plan that does not match how people actually value a theme-park day.
Adding ride time produces a more realistic allocation
When ride duration was added, the model became more realistic and the allocation changed noticeably. The notebook reports that overall wait time dropped from 11.98 hours to 10.07 hours once ride time was included, because time spent actively enjoying attractions now consumed part of the daily budget.
That change slightly reduced the objective value, but in a good way: it forced the optimization to distinguish between time spent waiting and time spent actually riding, which is much closer to how a visitor experiences the park.
Scenario summary from the notebook outputs
Rather than reproducing the full ride-selection dataframes, the most useful summary is the final printed totals from the notebook for each scenario:
| Scenario | Satisfaction | Wait Time (h) | Ride Time (h) | Total Time (h) |
|---|---|---|---|---|
| Base model without ride time | 125.25 | - | - | 11.98 |
| Base model with ride time | 114.25 | 10.07 | 1.92 | 11.98 |
| Must-ride popular attractions | 112.00 | 10.18 | 1.72 | 11.89 |
| Hagrid scenario without express pass | 112.00 | 10.18 | 1.72 | 11.89 |
| Hagrid scenario with express pass | 148.50 | 8.76 | 3.13 | 11.90 |
Two observations stand out immediately. First, adding ride time lowers the objective but gives a more realistic decomposition of the day. Second, the express-pass scenario materially changes the solution, increasing both satisfaction and actual ride time while reducing queue time.
The tradeoff model exposes a real Pareto frontier
The tradeoff model was one of the most informative parts of the project. Varying produced a clear frontier between satisfaction and total waiting time. In the high-satisfaction region, waiting time rises quickly because the model leans toward the park’s most desirable attractions. In the low-wait region, the plan becomes more repetitive and relies on lower-demand rides, reducing the total experience value.
That result matters because it turns a single recommendation into a family of recommendations. Different visitors can choose where they want to sit on that frontier depending on whether they care more about minimizing queues or maximizing thrill and variety.
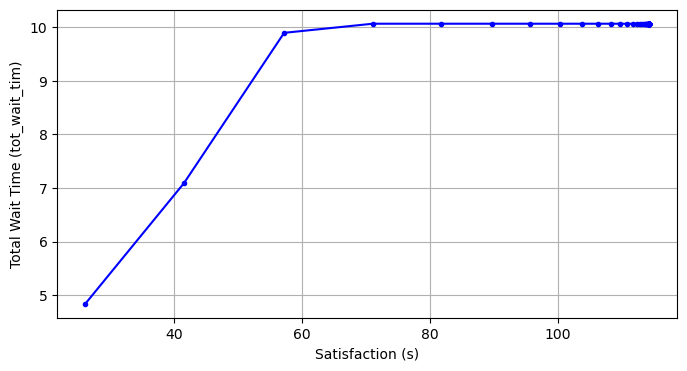
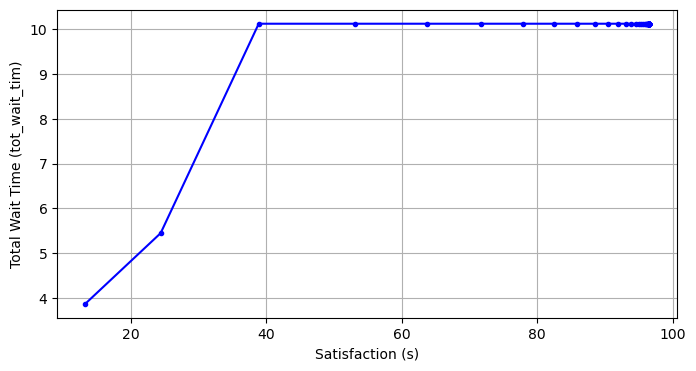
The saved pyplot outputs make the seasonal effect especially clear. The off-peak curve supports higher satisfaction before queue time saturates, while the peak-season curve shifts that frontier downward, meaning that visitors give up more satisfaction for the same queue burden on crowded days.
Express pass can change the problem dramatically
The express-pass experiment showed one of the clearest quantitative gains in the notebook. In the scenario requiring at least one ride on Hagrid’s, purchasing the pass increased the satisfaction score from 112 to 148. The total ride time also increased from 1.72 hours to 3.13 hours because much less of the day was wasted in lines.
This is a nice example of optimization supporting a real consumer decision. The model does not just say that the pass is “good”; it shows how much additional ride time and satisfaction it can buy under a specific planning scenario.
Peak-season crowding significantly lowers the achievable experience
Using peak-season waiting times produced a visibly worse satisfaction-wait frontier. The notebook notes that the peak-day satisfaction score falls below 100, whereas the comparable off-peak case is around 115. In other words, higher crowding meaningfully compresses the quality of the optimal experience, even when the visitor is following the best available plan under the model.
This gives the project a strong practical takeaway: if flexibility exists, visit timing can matter almost as much as itinerary design.
My contribution
This was a team project, and the final notebook reports equal contributions across modeling, analysis, data gathering, software implementation, and report writing. My contribution therefore spanned the full workflow rather than a narrow single component.
From a technical standpoint, the part I find most meaningful is the optimization framing itself: taking a familiar everyday planning problem and turning it into a family of MILP formulations that expose different policy choices. That included helping translate qualitative questions such as “Is the express pass worth it?” or “How much should we penalize waiting?” into objectives and constraints that could actually be solved and interpreted.
Limitations and future work
The notebook is very clear that this model is intentionally simplified. It does not include meals, shows, photos, rest breaks, or route-level movement through the park. Walking time is treated as a fixed buffer rather than using real pairwise distances between rides, and wait times are represented by daily averages instead of full time-varying queue trajectories.
Those limitations point directly to the next version of the problem. The most natural extensions would be:
- replacing average waits with dynamic wait-time profiles across the day,
- adding route planning with actual travel times between attractions,
- including non-ride activities such as meals and shows,
- and replacing generic satisfaction proxies with user-specific preference surveys.
Conclusion
This project was a good example of how optimization becomes useful when it connects directly to a concrete decision problem. The solution was not just an abstract MILP exercise; it produced interpretable answers about ride prioritization, wait-time tradeoffs, express-pass value, and seasonal timing.
It also reinforced an important modeling lesson for me: a good optimization model is not only about solving an objective efficiently, but about choosing the right abstractions so the answer means something in the real world. Even with simplified assumptions, the project showed how a structured optimization approach can turn a messy planning problem into actionable guidance.